Everyone learns that the roots of a polynomial have a graphical interpretation: they’re the places where the function crosses the x-axis. But what happens when the equation has only imaginary roots? Do those have a graphical interpretation as well?
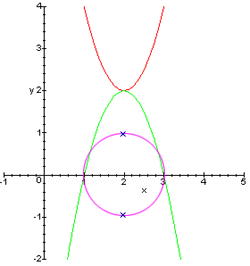
Here’s an interpretation that works for quadratics. Take a quadratic, such as 2x2 – 8x + 10, and graph it. In the Figure 1, it is shown in red. Because it lies entirely above the x-axis, we know it has no real roots.
Now, reflect the graph of this quadratic through its bottom-most point, and find the x-intercepts of this new graph, shown in green. Finally, treat these intercepts as if they were on opposite sides of a perfect circle, and rotate them both exactly 90 degrees. These new points are shown in blue.
If interpreted as points in the complex plane, the blue points are exactly the roots of the original equation! (In our example, they are 2+i and 2-i.)
Presentation Suggestions:
Use different colors of chalk to represent various parts of the diagram.
The Math Behind the Fact:
You can prove it by expanding the generic equations:
(x-a)2 + b and -(x-a)2 + b
and then comparing their roots (using the quadratic equation).
How to Cite this Page:
Su, Francis E., et al. “Complex Roots Made Visible.” Math Fun Facts. <http://www.math.hmc.edu/funfacts>.
References:
A. Norton and B. Lotto, “Complex Roots made Visible”, College Math J., 1984, number 3, pp. 248-249.
Fun Fact suggested by:
Dominic Mazzoni

